Different industries.
The same powerful idea.
Whether it's paperwork, a packed inbox or a fleet of vehicles, repetitive work can become a clearer, faster process. Try three interactive examples below.
Turn an invoice into useful data.
Pick a fictional document from the demo file browser, inspect the source image and watch the fields appear — ready to review, compare and export.
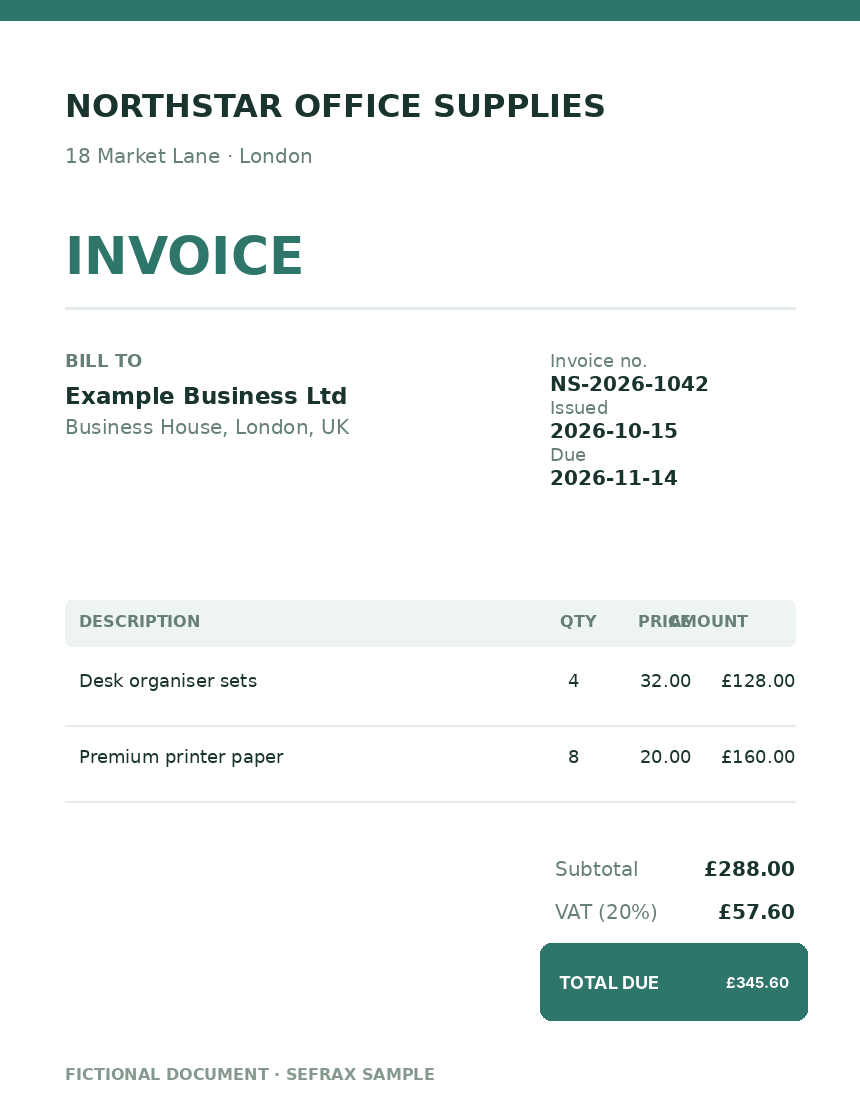
Choose a sample file and click Extract data to run the visual simulation.
Previewing a possible Sefrax workflow
Get the point. Skip the noise.
Select a fictional business email and see how key decisions, deadlines and action items could be presented.
Choose a message and press Summarise email to see a prepared brief.
Showing predefined summary and action items
Know which trucks perform best.
Compare fictional vehicles using miles driven and money spent on diesel. Find the lowest fuel cost per mile and understand the difference.
| Vehicle | Miles | Diesel (L) | Fuel spend |
|---|
Change the period, then click Analyse fleet. Results are calculated from the example numbers.
Calculating miles, litres and fuel spend
Fuel cost per mile
Lower is betterEvery document, email and fleet record here is fictional. Processing animations are simulated, and your interaction stays in the browser. A customer deployment would be tailored, tested and run on their infrastructure.
What would you automate?
Invoices, customer emails, vehicles, inventory, reporting — tell us what actually takes time in your business. Your input will shape what we build first.
Take the short survey